Latest topics
Florida Blog

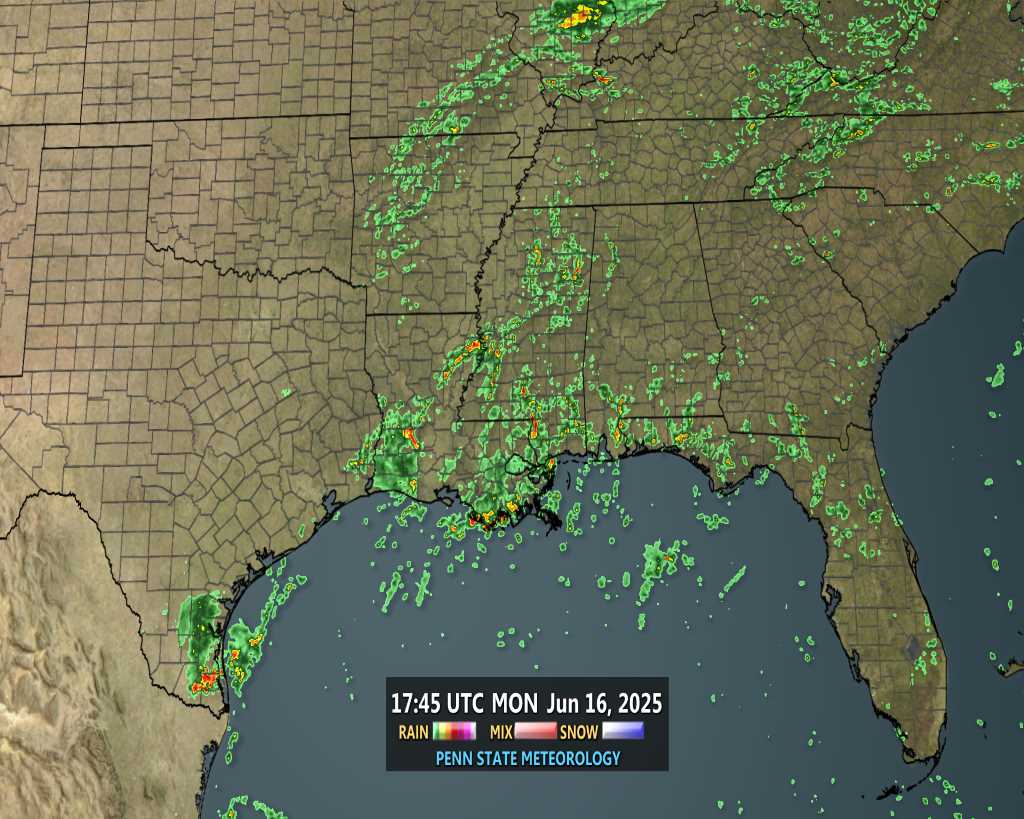
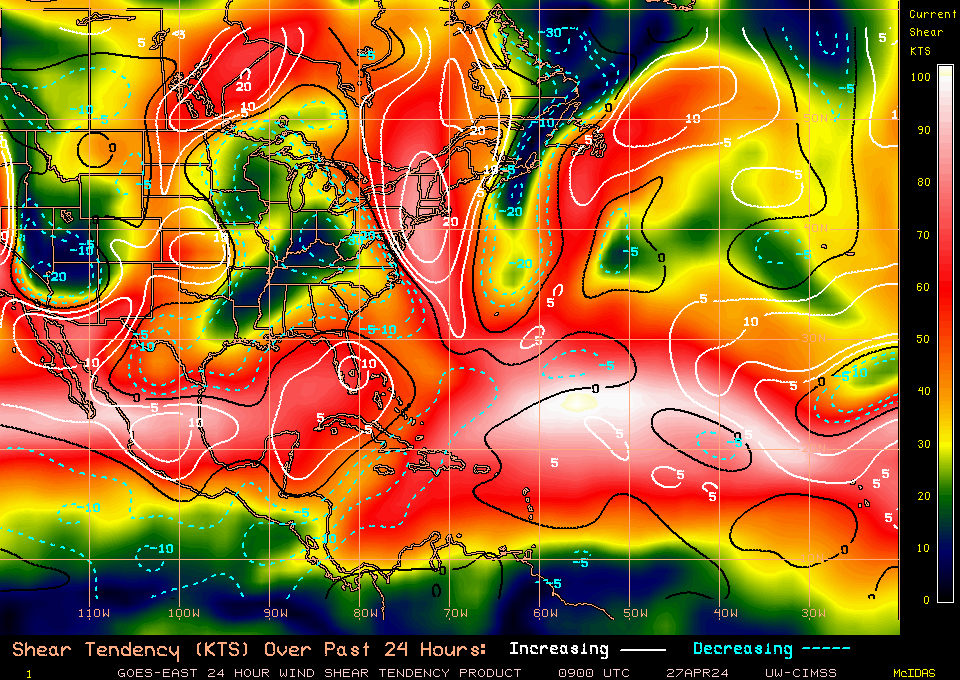
Southeast Radar Loop
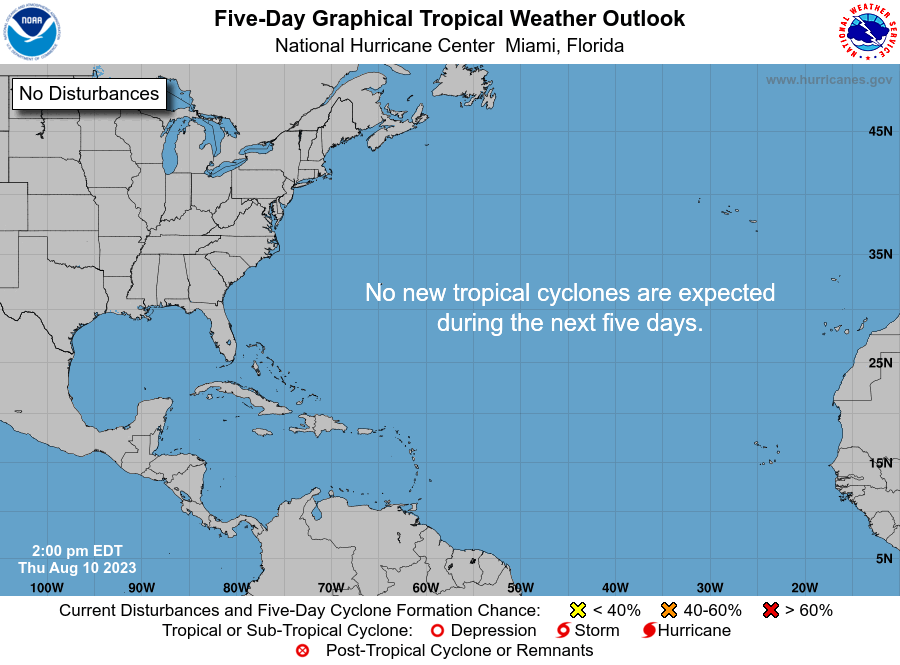
Kamala Severe Warnings

Warnings
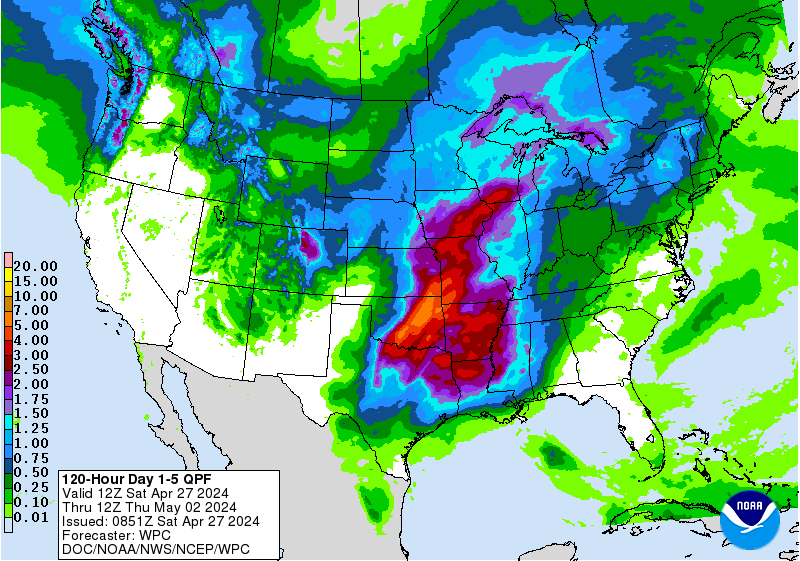
WPC 5 Day Precip
Most Viewed Topics
Search
READING A SIMPLE STATION MODEL
+2
scouter534
Seawall
6 posters
Page 1 of 1

READING A SIMPLE STATION MODEL
![]() by Seawall Thu Jul 19, 2012 11:19 pm
by Seawall Thu Jul 19, 2012 11:19 pm
By learning to read a simple station model plot found on surface maps from all over the CONUS, we can learn to approximate the location of fronts, and many other weather changes without having the latest maps explaining in detail where the fronts are located.

Temperature and Dew Points are expressed in Fahrenheit in the US. The Temperature is shown on the upper left side of the model, and the Dew Point on the lower left. In the above sample, it is 76 F. and the Dew Point is 55 F at the surface.
Wind is expressed in Knots. A longer horizontal bar on the wind barb equates to 10 knots, and a line half of that is 5 knots. Always read the direction as the barb is pointed into the wind. In the above example, the wind is blowing FROM the Northeast at approximately 20 Knots.
Pressure is Sea Level Pressure, and is located on the upper right hand side of the model. It is measured in mb. The reading on the model is initially expressed as 13.8; which is actually a SLP of 1013.8 mb. To convert the 13.8 to 1013.8, use this handy rule:
The line in the center on the right side of the model tells us the pressure has risen slightly, but then decreased overall by .3 mb in the past three hours. (The bottom right hand number.)
The dark center portion of the circle in the center attached to the wind barb expressed the cloud cover in the sky. In the above example, the fully dark circle tells us the skies at this location are covered in clouds.
Current weather is expressed on the left center line. The current weather is rain in the example station model. Below is a key to common current weather symbols.

With a little practice on surface model maps online, you will soon be plotting your own fronts and boundary lines!
Temperature and Dew Points are expressed in Fahrenheit in the US. The Temperature is shown on the upper left side of the model, and the Dew Point on the lower left. In the above sample, it is 76 F. and the Dew Point is 55 F at the surface.
Wind is expressed in Knots. A longer horizontal bar on the wind barb equates to 10 knots, and a line half of that is 5 knots. Always read the direction as the barb is pointed into the wind. In the above example, the wind is blowing FROM the Northeast at approximately 20 Knots.
Pressure is Sea Level Pressure, and is located on the upper right hand side of the model. It is measured in mb. The reading on the model is initially expressed as 13.8; which is actually a SLP of 1013.8 mb. To convert the 13.8 to 1013.8, use this handy rule:
- If the station model pressure value starts with a 0, 1, 2, 3, 4, or 5; ADD a 10.
- If the station model pressure value startkes with a 7, 8, or 9, then ADD a 9.
The line in the center on the right side of the model tells us the pressure has risen slightly, but then decreased overall by .3 mb in the past three hours. (The bottom right hand number.)
The dark center portion of the circle in the center attached to the wind barb expressed the cloud cover in the sky. In the above example, the fully dark circle tells us the skies at this location are covered in clouds.
Current weather is expressed on the left center line. The current weather is rain in the example station model. Below is a key to common current weather symbols.
With a little practice on surface model maps online, you will soon be plotting your own fronts and boundary lines!

Seawall- Posts : 125
Reputation : 3
Join date : 2012-07-16
Re: READING A SIMPLE STATION MODEL
![]() by scouter534 Fri Jul 20, 2012 8:25 am
by scouter534 Fri Jul 20, 2012 8:25 am
Thanks Sea. Great job. Wish I could see your images. (Only admins are allowed to see this image).

scouter534- Posts : 128
Reputation : 1
Join date : 2012-07-16
Age : 62
Location : Pompano Beach, FL
Re: READING A SIMPLE STATION MODEL
![]() by emcf30 Fri Jul 20, 2012 8:51 am
by emcf30 Fri Jul 20, 2012 8:51 am
Test........Quick Reply...............

emcf30- Posts : 975
Reputation : 10
Join date : 2012-07-16
Age : 93
Re: READING A SIMPLE STATION MODEL
![]() by gomexwx Fri Jul 20, 2012 9:56 am
by gomexwx Fri Jul 20, 2012 9:56 am
ok...this time I see pictures..thanks for the write up:)

gomexwx- Posts : 641
Reputation : 63
Join date : 2012-07-16
Location : On an Acre somewhere on the gulf Coast
Re: READING A SIMPLE STATION MODEL
![]() by sangria Fri Jul 20, 2012 10:04 am
by sangria Fri Jul 20, 2012 10:04 am
Thanks a bunch Sea......Great blog!!!!!

sangria- Admin
- Posts : 2345
Reputation : 55
Join date : 2012-07-16
Re: READING A SIMPLE STATION MODEL
![]() by Tropic Bunker Sat Jul 21, 2012 7:01 am
by Tropic Bunker Sat Jul 21, 2012 7:01 am
Very informative and simple to understand. Thanks a lot Sea!

Tropic Bunker- Posts : 70
Reputation : 1
Join date : 2012-07-16
Age : 85
Location : Miami
Re: READING A SIMPLE STATION MODEL
![]() by emcf30 Mon Jul 23, 2012 2:26 pm
by emcf30 Mon Jul 23, 2012 2:26 pm
Very informative Sea. Thanks, I was always wanting to know how to read those darn things. No but keeping it real, nice job of explaining for those who did not know how to read such charts
emcf30- Posts : 975
Reputation : 10
Join date : 2012-07-16
Age : 93
Page 1 of 1
Permissions in this forum:
You cannot reply to topics in this forum

» summer 2019 hurricane season
» April-May Florida weather and local events etc
» NASCAR 2019
» Late January through February outlook
» FLORIDA/ALABAMA AND THE HOLIDAY SEASON WEATHER
» NASCAR 2018
» CLOSED Florida/Alabama Blog - October Tropical Mischief